


Several factors, such as introducing new fields, new wells, or performing facility upgrades and maintenance, affect the production of already producing fields. This is mostly because of flow and processing capacity constraints and pressure effects in the flowlines. To support project investment decisions, incremental profile analyses can be performed to quantify the net production of the entire project,
Incremental profiles are based on two scenarios, a base case, and a new case, within the same forecast. In fact, the total production of the incremental profile is the difference between the base case and the new case. See the equation below:
volumeincrement(t) =
volumenew case(t) −
volumebase case(t)
Now, let us explain the methodology behind deriving incremental profiles by an example. For instance, an asset (business unit) includes three fields, Draco, Mars, and Polaris. Figure 1 shows the field layout.
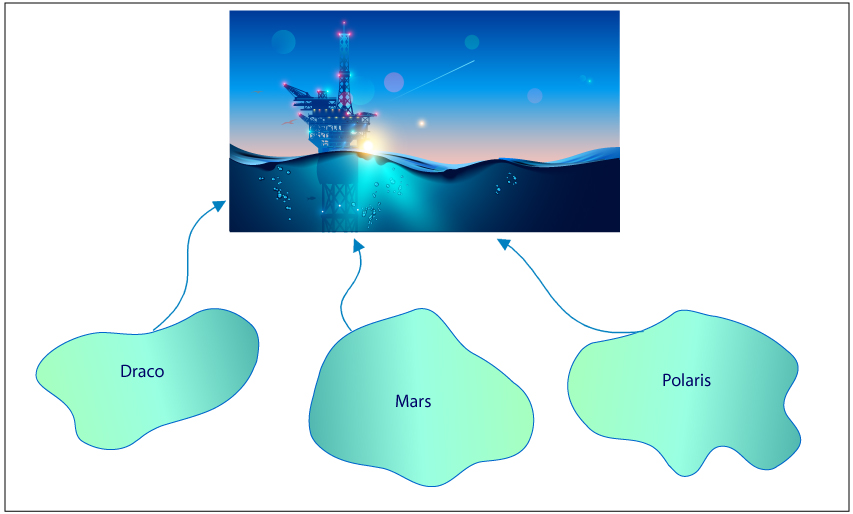
Figure 1: Schematic of field layout; an asset with three fields.
Draco and Mars are the two producing fields and, in our example, the combined production of these two fields represents the base case. A new field, Polaris, has been recently evaluated and its production together with the producing fields (Draco and Mars) will represent the new case. To derive incremental profiles, we need to run two separate scenarios within the same forecast. In the first one, pForecast draws input and calculates production profiles for the base case, see Figure 2. In this figure, you can see the gross production of oil over a period of ten years for both the Draco and Mars oil fields.
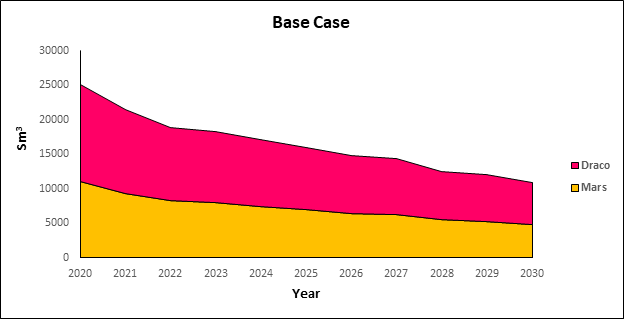
Figure 2: Base case. Production profiles for Draco and Mars.
In the second scenario, production profiles for the new case are calculated. Figure 3 illustrates the oil production from the new field, Polaris, and its effect on the production of the other fields. In 2023, which is the year that the new field (Polaris) is introduced, a noticeable decrease in the oil production from the Draco and Mars fields can be observed. In this case, the reduction is due to the processing capacity constraints.
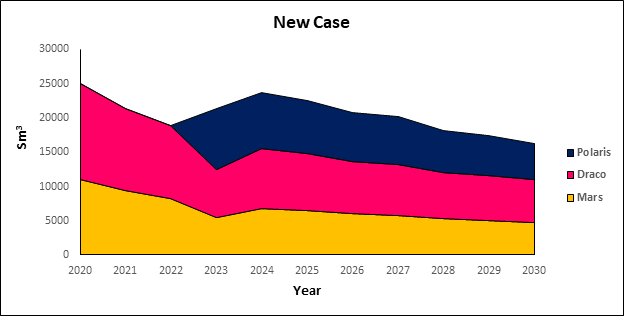
Figure 3: New case. Production profiles for Draco, Mars, and Polaris.
The difference between these two scenarios results in the incremental profile. In other words, the difference between the sum of production for the new case and the sum of production in the base case is equal to the increment. Figure 4 shows the incremental profile, in light purple, on top of the base case.
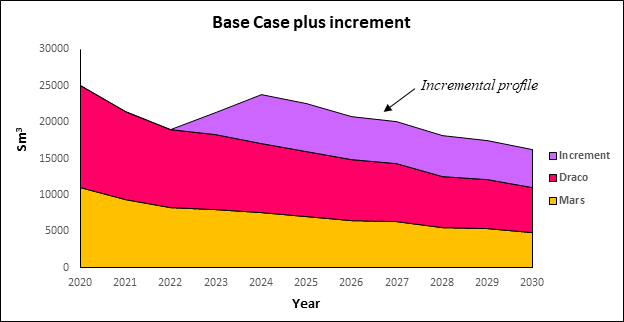
Figure 4: Base case with the incremental profile.
Figure 5 shows the increment on its own. This is the difference in total produced volume before and after introducing the Polaris field.
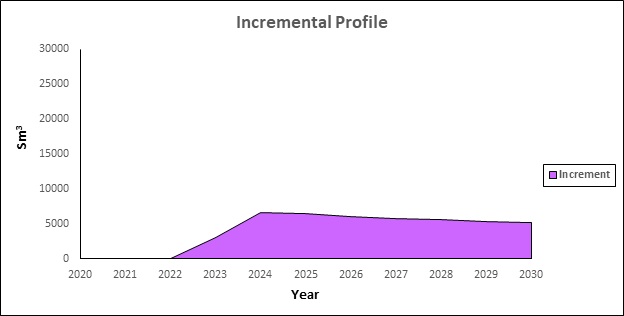
Figure 5: Incremental profile.
It is worth mentioning that in our example this increment is from one deterministic run. In the pForecast software, this process repeats in the underlying Monte Carlo simulations in order to derive percentile estimates for incremental analyses.
This new feature in pForecast enables users to drive incremental profiles in a reliable, efficient, and easy way, providing the necessary basis for decision-making and risk management.