
pForecast performs both deterministic and stochastic analyses and generates unbiased production forecasts. The presented article provides a brief overview of the powerful reporting functionality in pForecast.
In pForecast, the user can choose between yearly or monthly plot granularity. It is also possible to present both stream day rates, assuming 100 percent uptime, and calendar day rates accounting for planned and unplanned downtime. It is also worth mentioning that the user can run between 10 to 2000 simulations and derive production distributions for different scenarios.
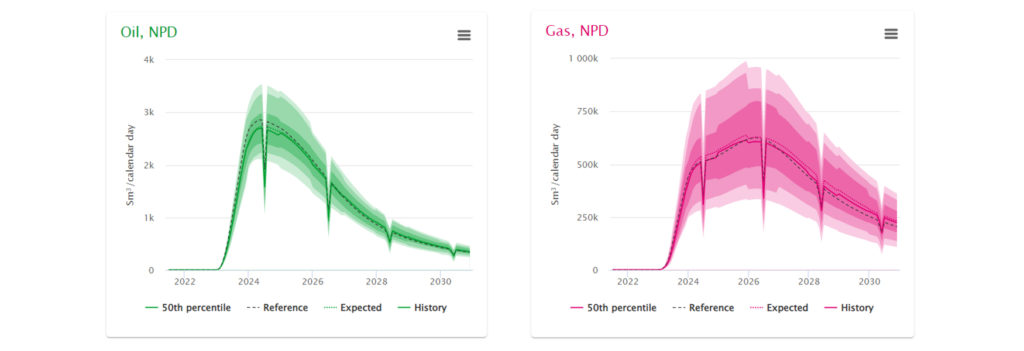
Now, let us take a look at an example of production profiles, generated by pForecast. Figure 1 indicates the oil and gas production profiles after running 50 simulations, for an offshore oil field with 20 producers. Looking at the figure in more details, dropdowns in the production profiles indicate biannual planned shutdowns due to facility maintenance. In this case, four turnarounds (TAR) have been defined and uncertainty has been assigned, both for the start date and the duration of these scheduled shut-ins.
Normally, the uptime for the production facilities is close to 100%. In pForecast, in addition to most likely values for production efficiencies (PE), it is possible to provide upside and downside cases. For instance, In Figure 1, PEmost likely, PElow and PEhigh are 95%, 85% and 97% respectively, using a triangular distribution (P10,P90).
Moreover, in the case of applying improved oil recovery (IOR) techniques, the user can supply the duration and mode for the injector to generate injection profiles. The mode can be one of the following:
- Water injection
- Gas injection
- Water alternating gas (WAG) injection
- Gas lift
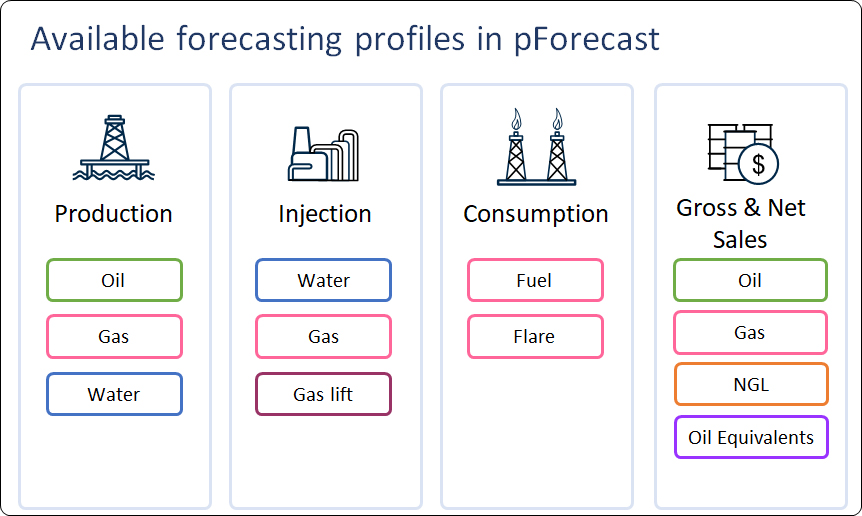
In addition to production and injection profiles, by using pForecast, the user can easily generate other profiles, i.e., fuel and flare as well as gross and net sales. Figure 2 shows an overview of available profiles in pForecast software.
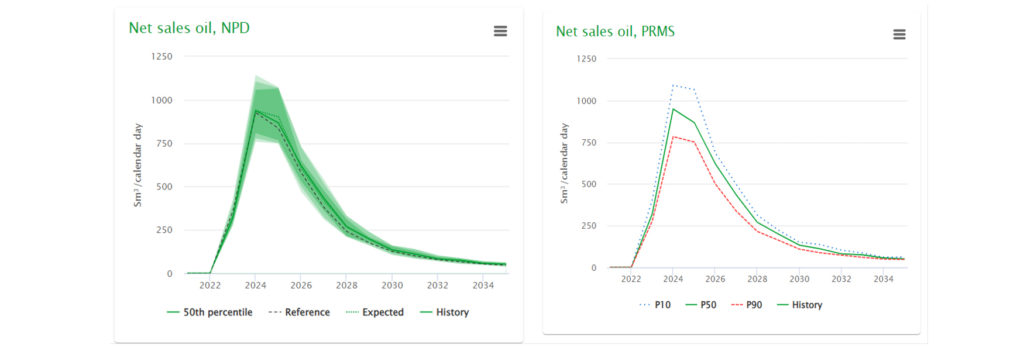
The extensive and powerful reporting functionality in pForecast allows users to create the reports they need, from the yearly national reporting to the government agencies through internal forecasts. pForecast supports automatic export to the company’s desired formats, including Petroleum Resources Management System (PRMS) and Norwegian Petroleum Directorate (NPD) standards. For instance, Figure 3 illustrates these two reports for net sales profiles for a particular offshore field, complying with NPD and PRMS standards respectively.