
Drilling schedule is a feature in pForecast that allows the end user to input detailed information about drilling plans to express how delays might affect future production. This article gives details on how end users of pForecast can consider the impact of rig availability and influence the scheduled time when there is no drilling activity.
Typically, the rig cannot be deployed the entire time it operates. Maintenance on the rig itself and other activities on the platform may hinder drilling operations. These activities can be categorized into two different types: planned or unplanned.
In pForecast software, unplanned periods without drilling are entered as rig availability. At the same time, planned work can be entered as non-drilling periods with fixed start times and uncertain duration.
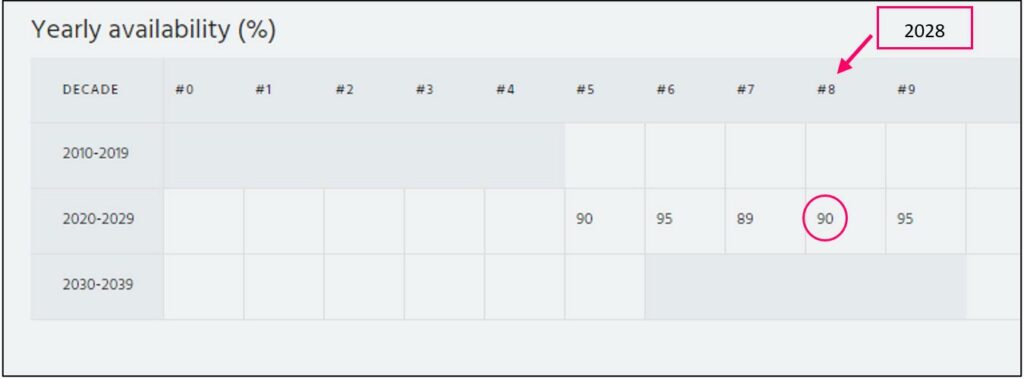
Let us first take a look at unplanned periods. A rig availability factor indicates how much a drilling rig is used for drilling wells. In pForecast, the rig availability factor is entered as a percentage annually and influences the drilling schedule performance. The rig availability for each year is entered in the embedded table (Figure 1) as a percentage. If no rig availability is given, pForecast assumes it to be 100%. For instance, as Figure 1 depicts, during 2028, the rig is 90% available.
If the rig availability in 2028 is 90%, then extra days are added to the drilling time due to the absence of the rig. This formula calculates added days:

Example: Assuming a drilling target will be drilled in 2024 with a rig availability of 90%, and a drilling time of nine days, what is the expected duration between the start date of drilling this well and the start date of drilling the next well?
Answer:

So, 10 Days (9+1) will it take from the start date of the drilling of this well until the start date of drilling the next well.
The effect of this is that the drilling of the well is finished after nine days, but the drilling start date of the next well will be postponed by one day.
Now let’s take a look at how pForecast models planned periods when there is no drilling. Such periods may occur due to planned maintenance stops, rig upgrades, or when the license owner has decided to put a stop to the drilling process for an extended period.
Each non-drilling period is assumed to have a fixed start time. However, it’s possible to define an uncertain span for the duration of the non-drilling period. For instance, Figure 2 shows how to model a non-drilling period where it is going to be no drilling from the 18th of September 2023. The duration of the stop is given by most likely, low, and high estimates.
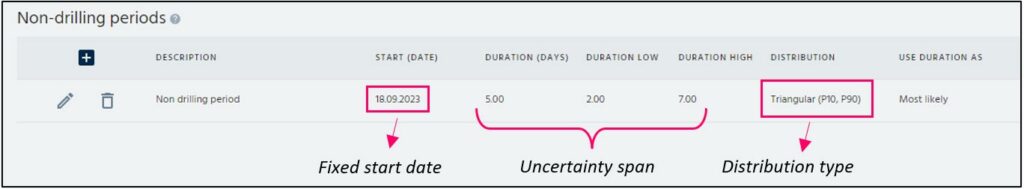
In our example, it will be 5, 2, and 7 days respectively (see Figure 2). Note that instead of the most likely value, the user can enter the expected duration. When it comes to distribution, pForecast supports several types:
- Triangular (P10, P90)
- Normal
- Pert
- Log Normal
- Uniform
- Triangular (P0, P100)
A drilling schedule can be linked to a non-drilling schedule to model planned events, while unplanned events can be modeled by linking the drilling schedule to a rig availability forecast.
Furthermore, pForecast allows for defining a hookup time for each well. This hookup time models the duration required from the completion of drilling until the well is ready for production.
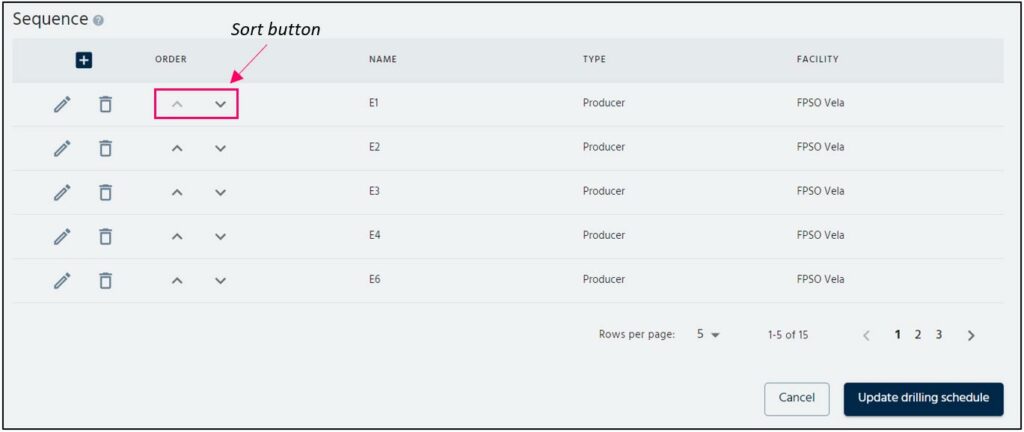
pForecast software provides users with the flexibility to define multiple drilling schedules with an unlimited number of drilling targets per schedule. The sequence of wells in each schedule can be easily modified, allowing users to move any well up or down in the sequence in seconds (see Figure 3).
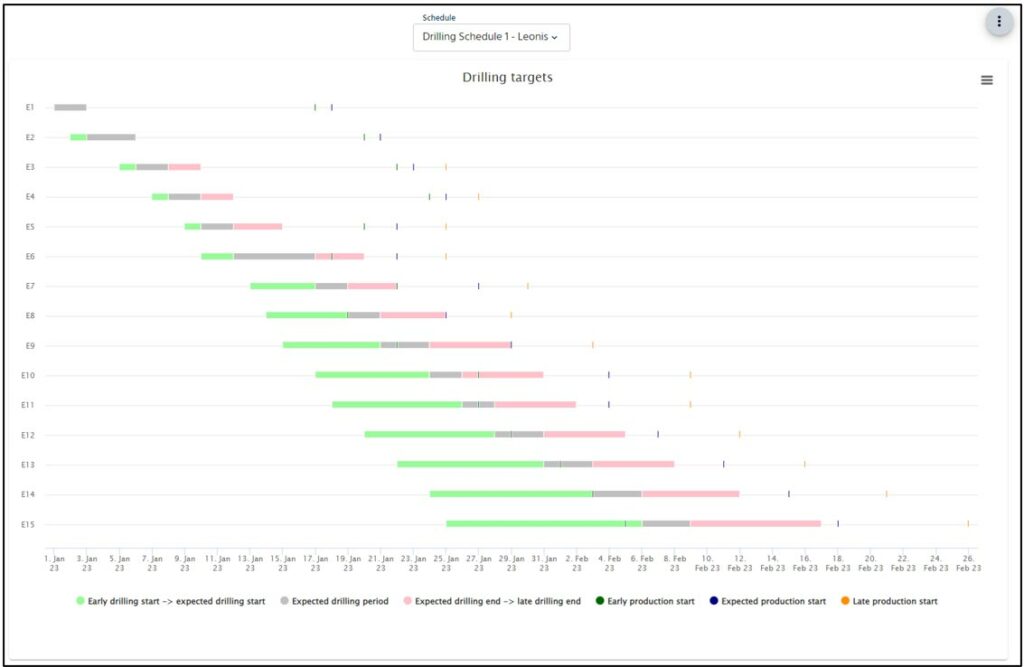
Once a drilling schedule is created and linked to the corresponding rig availability and non-drilling plan, the software automatically generates Gantt Charts to illustrate the drilling schedule and demonstrate how uncertainty propagates over drilling targets.
Figure 4 depicts a Gantt chart generated by pForecast for a drilling schedule comprising 15 drilling targets. Notably, the last drilling target (E15) exhibits a longer bar, which serves as an indication of how uncertainty propagates over the drilling schedule.